
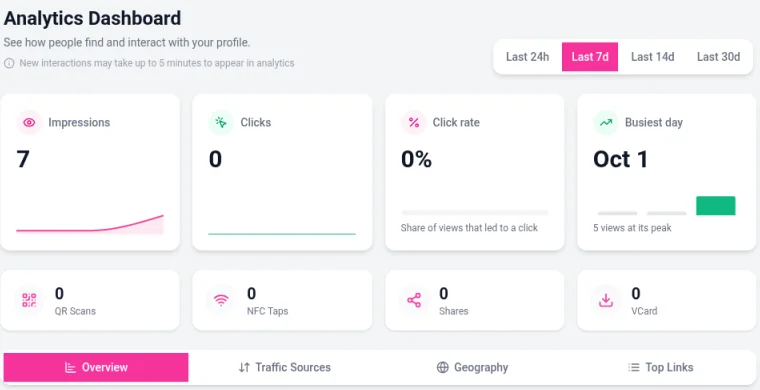
Analytics show how people find and use your profile. Open them from Analytics in the sidebar of your dashboard, or click Full analytics under the Last 7 days summary on the Links page.
Choose a time range
Use the buttons at the top right to switch between Last 24h, Last 7d, Last 14d and Last 30d.
New activity can take up to 5 minutes to appear, so if you just tested a link, give it a moment.
What each number means
Stat | What it counts |
|---|---|
Impressions | How many times your profile was viewed |
Clicks | How many times visitors clicked your links |
Click rate | The share of views that led to a click |
Busiest day | The day with the most activity in the range you picked |
QR Scans | Visits from someone scanning your QR code |
NFC Taps | Visits from someone tapping your NFC tag |
Shares | How many times your profile was shared, for example with the Share button |
VCard | How many times visitors saved your contact card to their phone |
Analytics are included on every plan, and also cover clicks on your social icons.
Dig into the details
Below the summary, the tabs break your stats down further:
Overview: your stats over time.
Traffic Sources: where your visitors came from, such as Instagram, TikTok or a QR code.
Geography: where in the world your visitors are.
Top Links: which links get the most clicks.
See stats for one link
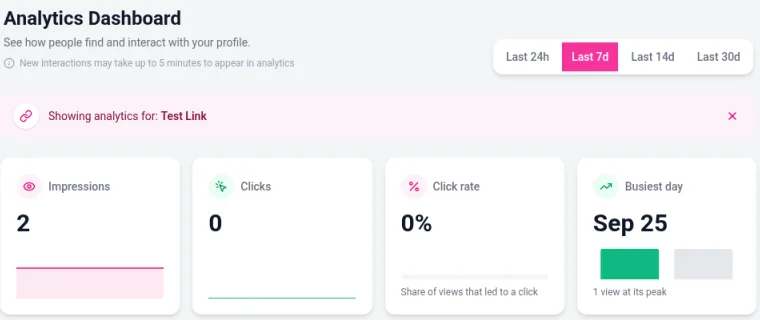
On the Links page, click the Analytics icon on any link card. The Analytics page opens with Showing analytics for: and the link name at the top. Click the x on that bar to go back to your whole profile.
Making sense of your numbers
A low click rate can mean your top links aren't what visitors are looking for. Try moving your most important link to the top, or use the Featured style to make it stand out.
Spikes in Traffic Sources show which posts or platforms are working, so you know where to focus.
QR Scans and NFC Taps tell you how well your printed codes and tags are doing at events.
Good to know
The longest range is the last 30 days. If you want to track longer trends, note your numbers down each month.
Analytics can't be exported. To keep a record, take a screenshot of the dashboard.